Swing trading screener: 6 rules to find strong stocks (a Chartink scan and a free build)
By Market Strength Scanner · Published 2026-11-05 · Updated 2026-11-10 · How the data works
Most swing trading screeners are either too loose (hundreds of stocks and no idea where to start) or too tight (zero results). This guide uses six simple rules that look for strong, liquid stocks in an uptrend with growing earnings. It explains why each rule is there, shows a ready-made Chartink scan built on the same idea, and then builds the same screen on Market Strength, saves it and copies the list to a TradingView watchlist.
Open the free scanner
Watch the step-by-step video: the six rules, the Chartink scan and the build on Market Strength.
The six rules at a glance
- Near the 52-week high: within 15% of it.
- Liquid: average volume above 1 lakh shares a day.
- Big enough: market cap above ₹2,000 Cr.
- Quality: ROE and ROCE above 20%.
- Growing: EPS rising quarter on quarter.
- Uptrend: price above the 50 and 21 EMA.
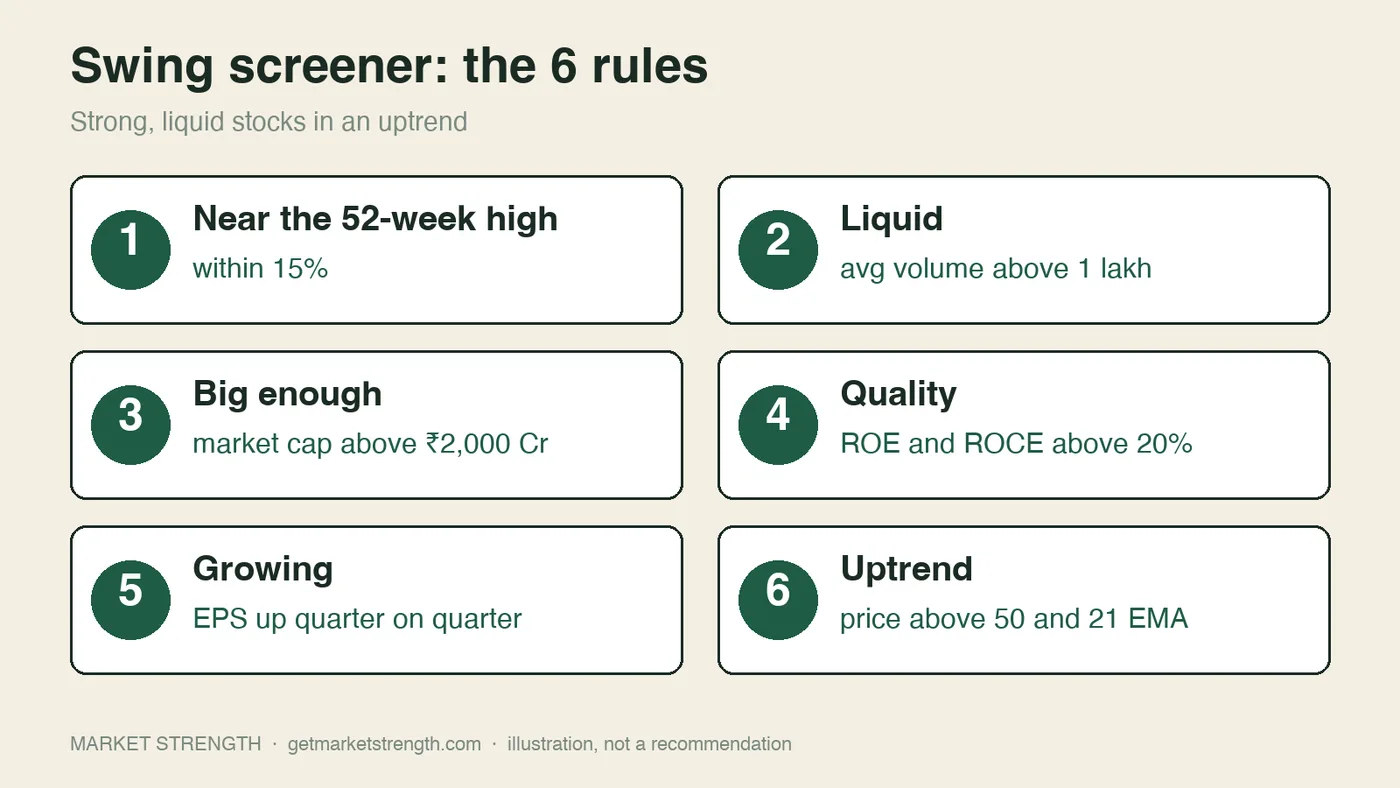
The six rules. A stock has to pass all of them to be worth a closer look.
None of the numbers are sacred. They are a sensible starting point, and every one of them can be changed to suit how selective you want to be.
Rule 1: stay within 15% of the 52-week high
The first filter asks how far a stock is from its 52-week high. If the high is ₹100, the stock must trade above ₹85 to pass. Stocks close to their highs are usually the ones in demand, and they have little old supply (people waiting to sell at break-even) above them. A stock 40% below its high is broken until proven otherwise.
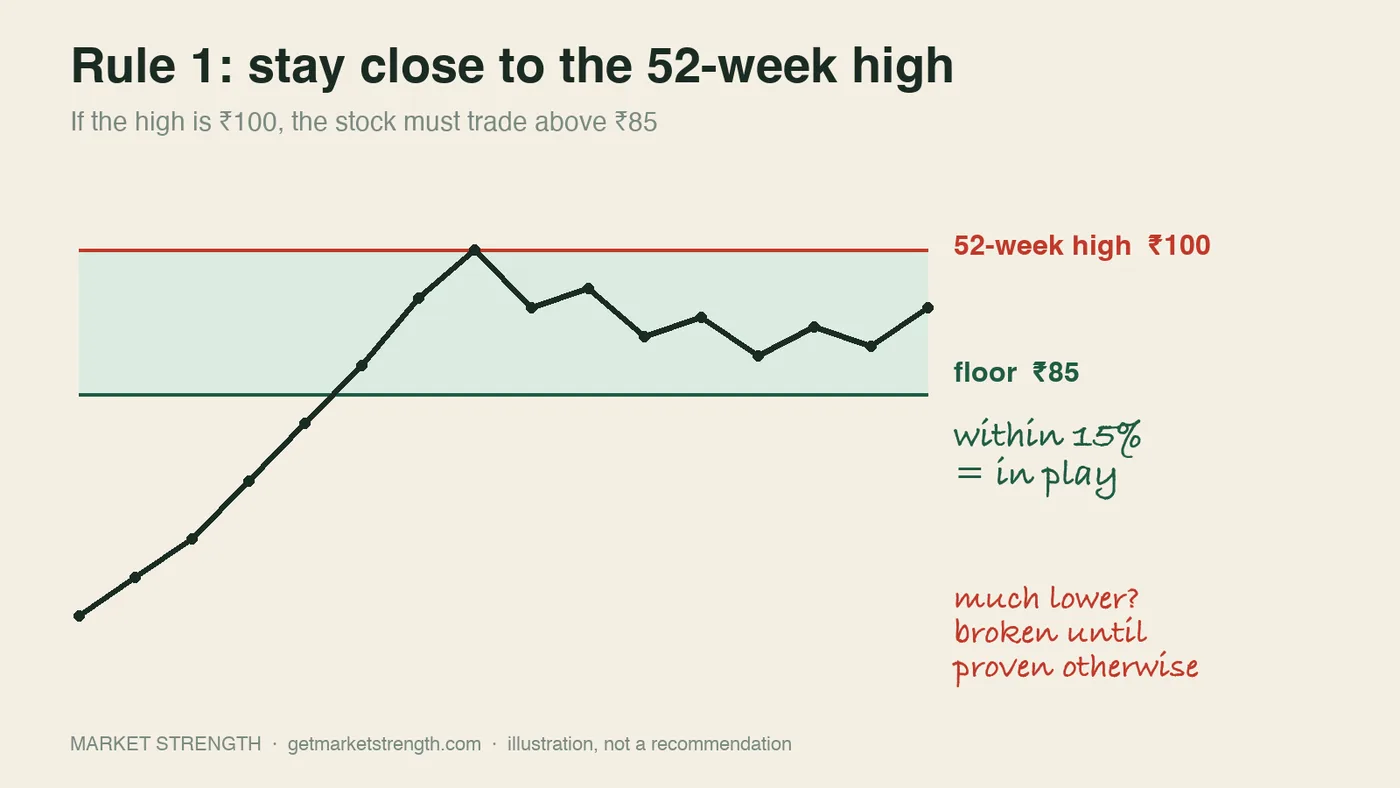
Illustration: a ₹100 high means the stock has to trade above ₹85.
You can loosen the rule to 20% or 25% if you want a longer list. The list of stocks that currently pass is on the stocks near their 52-week high page.
Rule 2: average volume above 1 lakh shares
A swing trade is only as good as your ability to get out of it. Average daily volume above 1 lakh shares keeps out the illiquid stocks, including the ones that sit in the 2% or 5% circuit, where you may not be able to exit when you want. If 1 lakh is too strict for you, 50,000 also works.
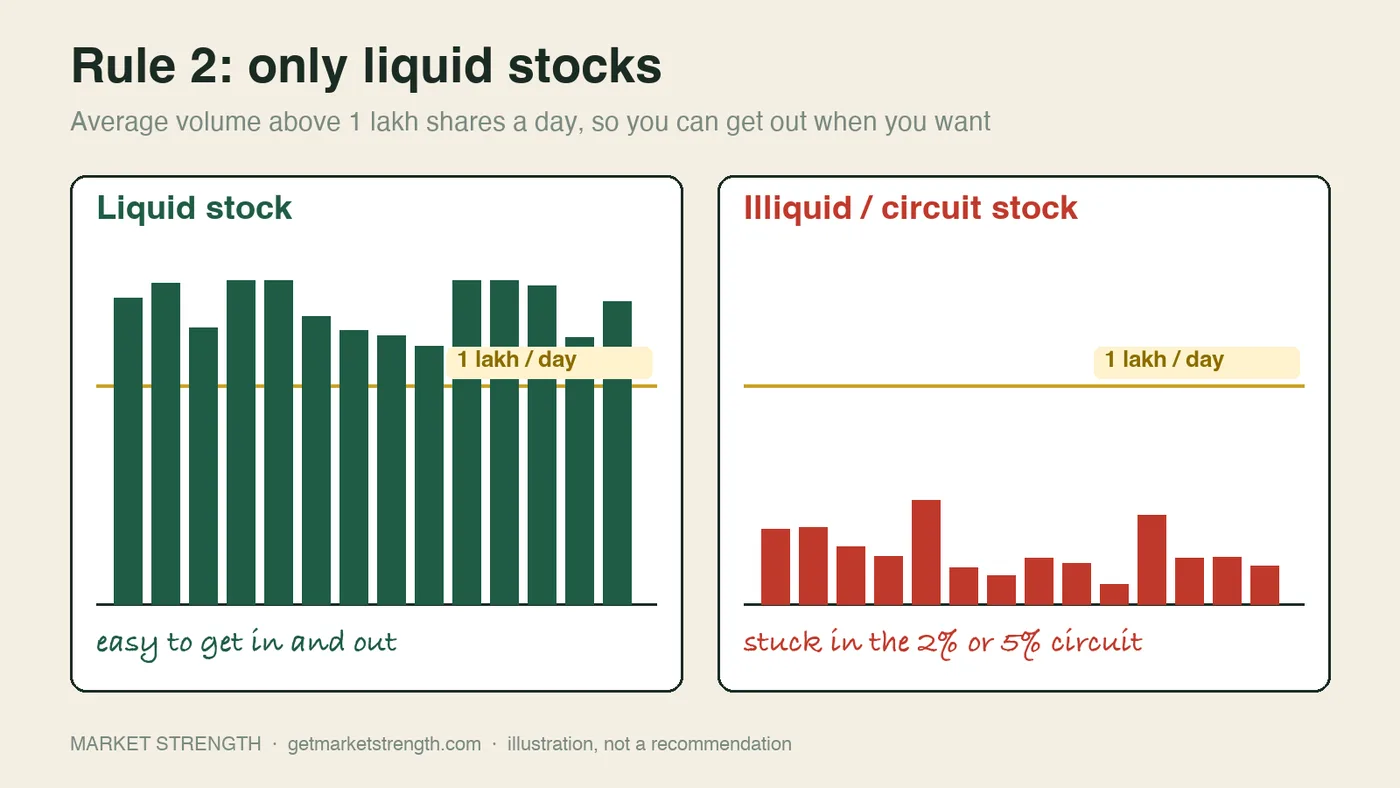
Illustration: liquid vs illiquid. You want to be able to get in and out.
Rules 3 and 4: market cap, ROE and ROCE
Market cap above ₹2,000 Cr removes very small companies with thin trading and big swings. ROE (return on equity: profit divided by shareholders’ equity) and ROCE (return on capital employed: profit before interest and tax divided by capital employed) check that the business earns well on the money in it. A reading above 15% is usually considered healthy, and 20% is the stricter filter.
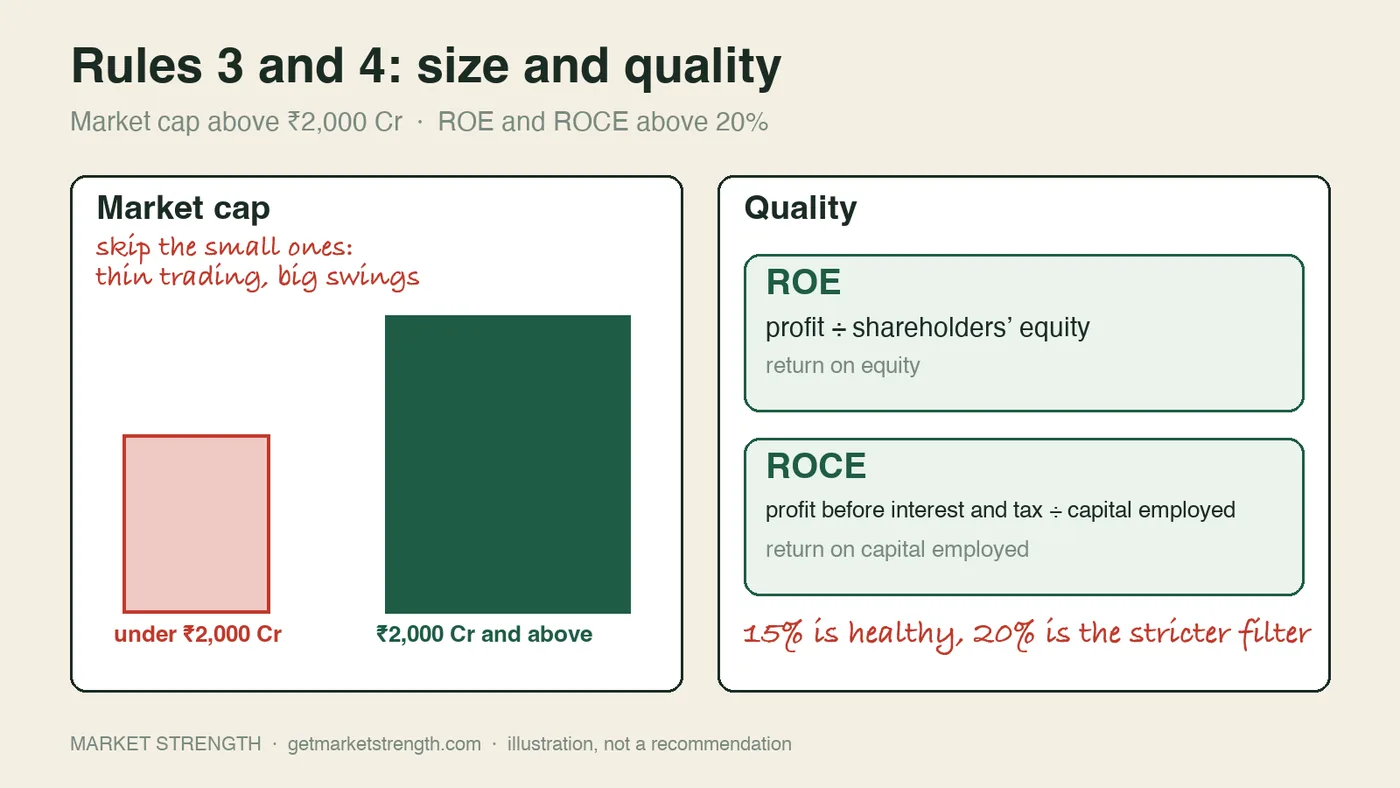
Size and quality: market cap, ROE and ROCE.
Rules 5 and 6: earnings growth and trend
EPS rising quarter on quarter is one of the most important rules. You want companies whose earnings keep growing, not just a price chart that looks nice. The last rule is a trend filter: the price should be above both the 50 and the 21 EMA, so you only see stocks that are already trending up.
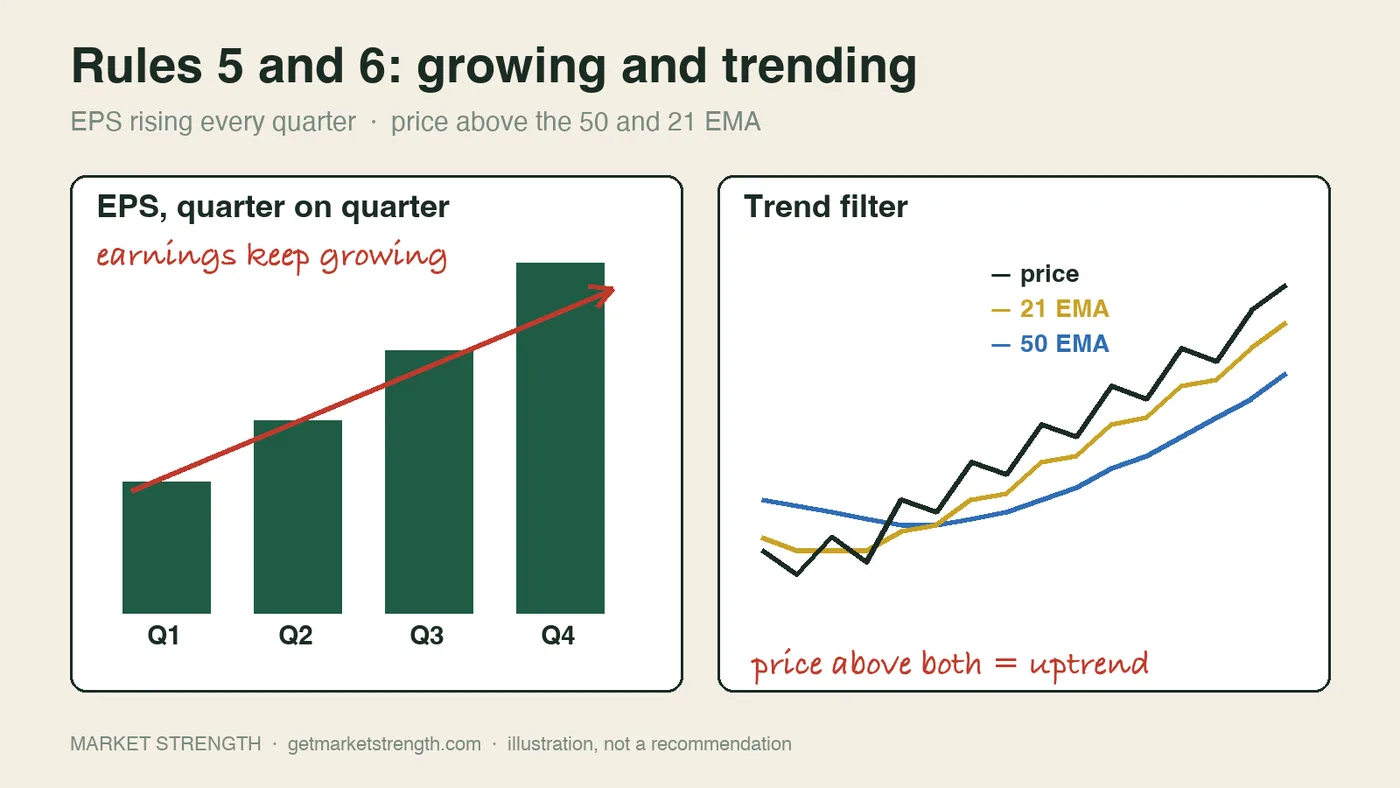
Illustration: earnings growing each quarter and price above both averages.
Together the six rules describe the same stock: close to its high, easy to trade, profitable, growing and trending.
A ready-made scan on Chartink
If you use Chartink, there is a ready-made swing trading scan built on this idea. Its description lists technical filters: price above the 21 and 50 EMA, the 20 EMA above the 50 EMA, price above ₹10 so there are no penny stocks, a close within 15% of the 52-week high, and a close higher than 65 days ago as a price-momentum check. It also lists fundamental filters: ROE and ROCE above 15%, consistent EPS growth, and rising FII holding.
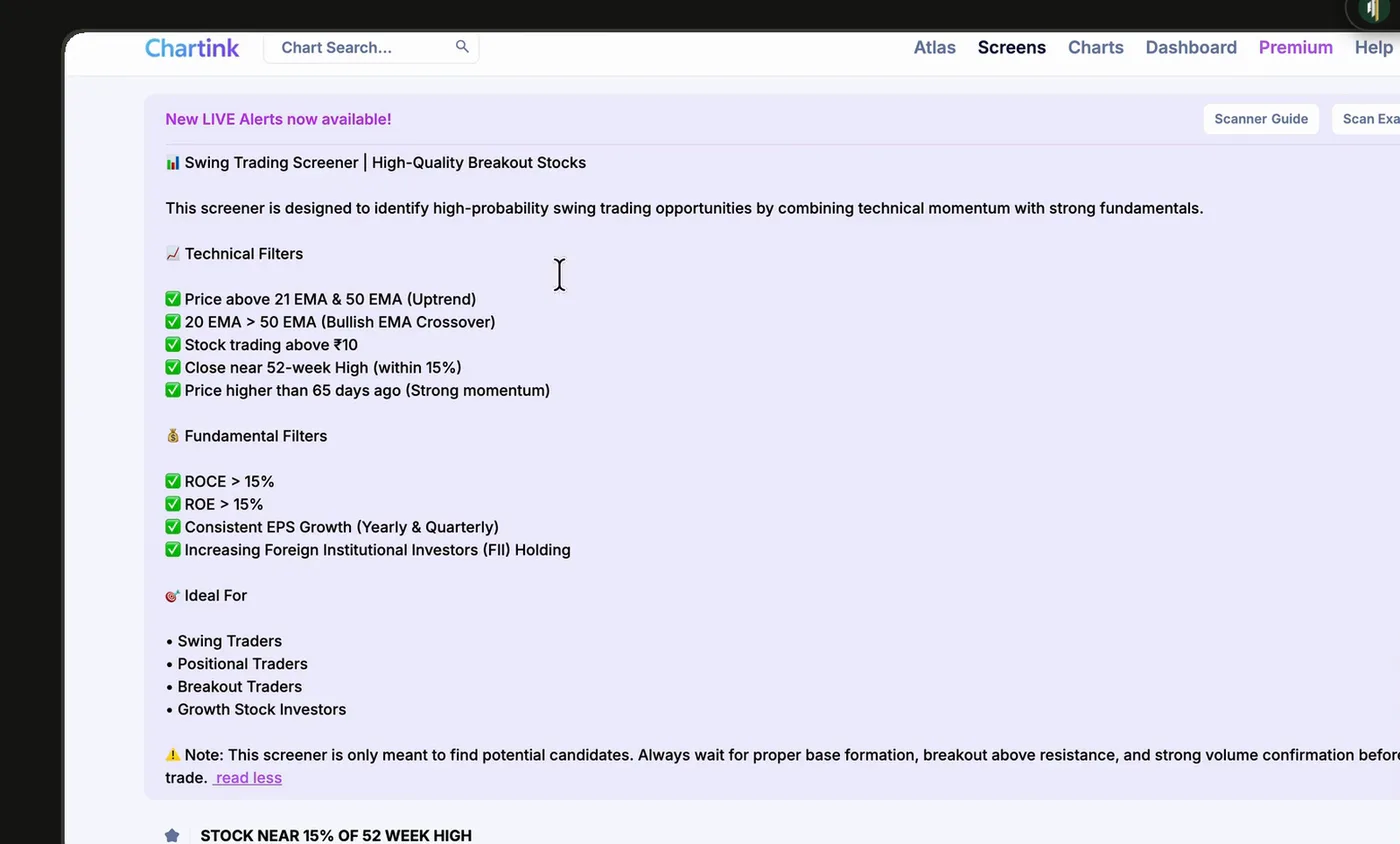
The ready-made Chartink scan and the filters it lists.
Any of its values can be edited, for example from within 15% of the 52-week high to within 25%.
Change the values, switch filters off
You do not have to keep every filter. If you do not need one, disable it and run the scan again. The more filters you stack, the fewer stocks you get, so keep only the ones you really need. For example, you can add an FII holding check (holding rising for two quarters in a row), but each extra condition shrinks the list.
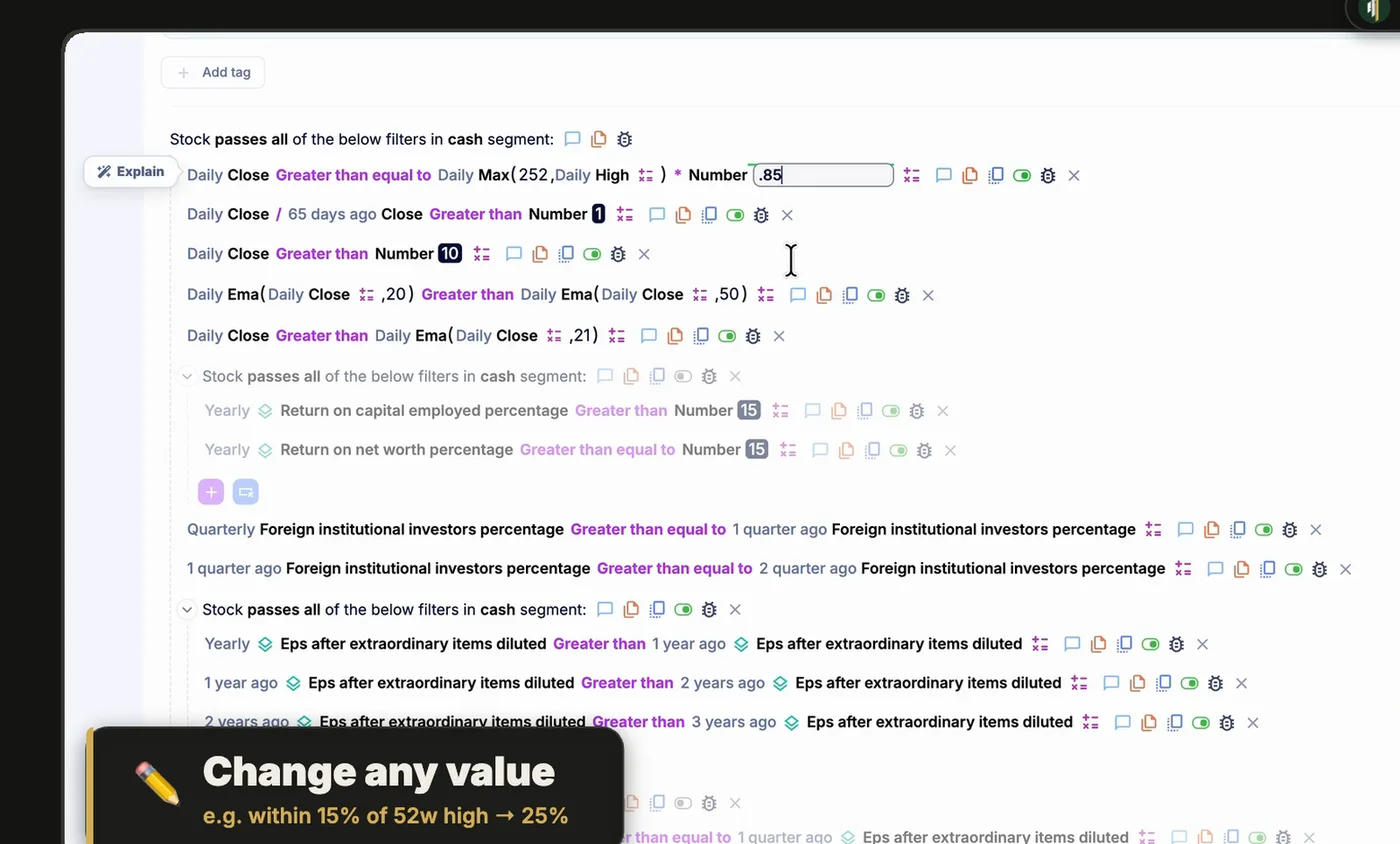
Every value can be changed, and any filter can be turned off.
Build the same screen on Market Strength
A scan like this shows you today’s list. For ideas you want to keep, a saved screen you can reopen and tweak is easier. On Market Strength you build it in the Stock Screener:
- Open the Stock Screener and choose All stocks, then the Custom screen builder.
- Add RS 3M ≥ 80. That keeps stocks that beat about 80% of the market over three months (see the RS rating guide).
- Add Price > EMA 21 and Price > EMA 50.
- Add Market cap ≥ 2,000 Cr, then ROE and ROCE. The walkthrough uses 10% to show more results; set 20% for the stricter rule.
- Add 52-week high: below it by ≤ 15% and 52-week low: above it by 50% or more.
- Optionally set the stage to Stage 2 (advancing) and pick a universe, such as Nifty Microcap 250.
- Save it with a name, such as “Momentum swing screen”.
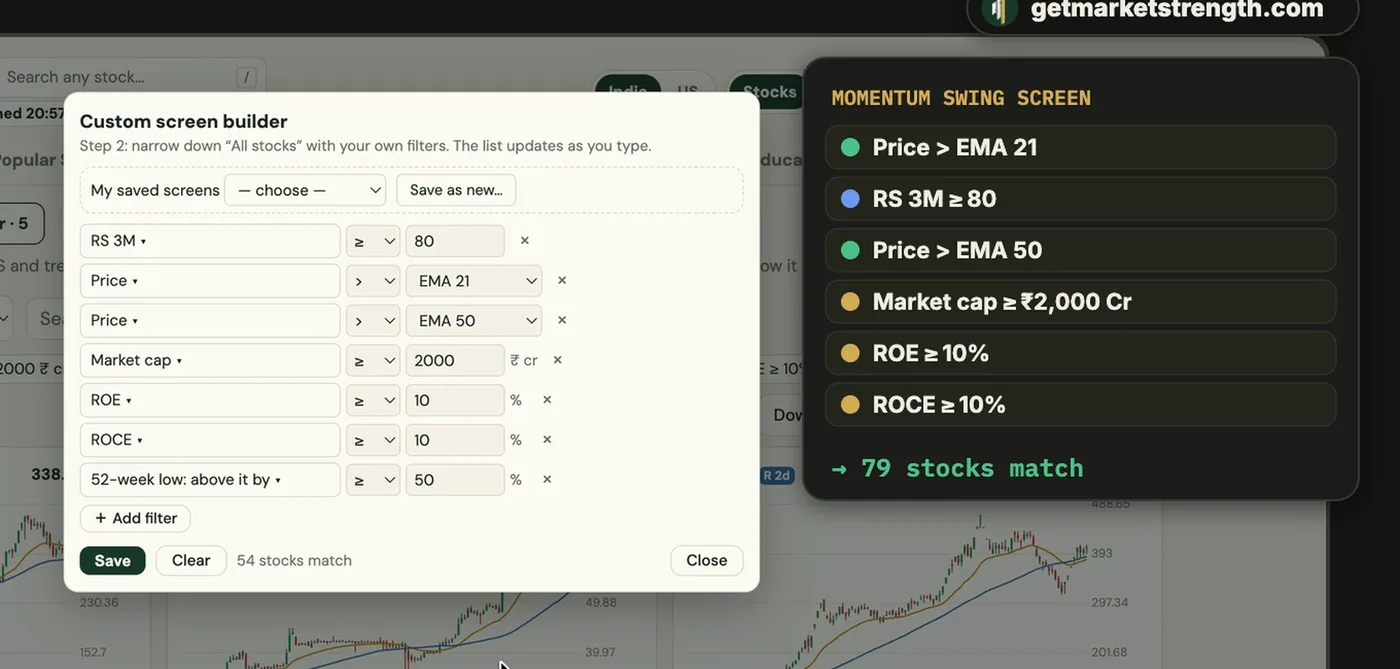
The custom screen builder. The list updates as you add filters.
The count of matching stocks changes every day, so the screen is a starting list, not a fixed set.
Results with RS, stage and volume on every card
Each stock that passes shows its RS rating, change in RS, stage, 1-month and 3-month return, distance from the high, relative volume, ADR and tags such as pocket pivot, flag or above 21 EMA. You can sort and filter the list further by tag, stage and returns.
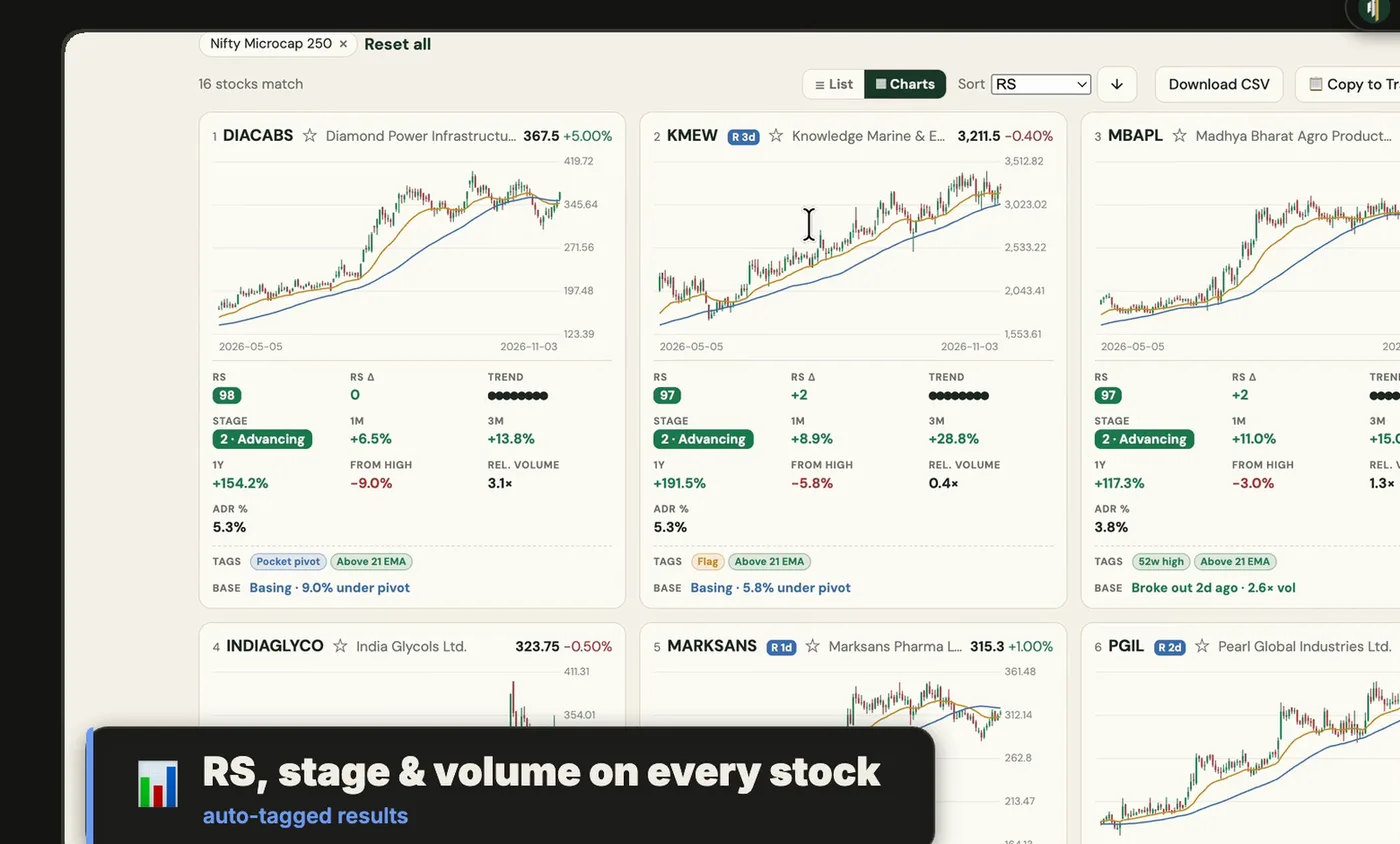
Results with RS, stage and volume on every stock.
If you chart elsewhere, Copy to TradingView copies the whole list so you can paste it straight into a TradingView watchlist instead of typing symbols one by one. Stocks shown in screenshots are screen results, not recommendations.
What a screen does not tell you
A screen only gives you a list. It does not tell you when to buy. You still need to look at each chart, wait for a sensible base and a pivot, decide where your stop goes and size the position from that stop. Rules are also worth testing: the strategy backtesting guide and the momentum backtest show how rules like these behaved in the past without using hindsight. Past results are not a forecast.
More ways to shortlist: free stock screeners for India, relative strength scanner, stage analysis.
Frequently asked questions
What is a good swing trading screener?
One that is selective enough to give a short list but not so tight that it returns nothing. A common starting point is stocks near their 52-week high, with enough volume, decent size, good ROE and ROCE, rising EPS and price above the 50 and 21 EMA.
Why look for stocks within 15% of the 52-week high?
Stocks near their highs are usually in demand and have little old supply overhead. The 15% limit is a rule of thumb and can be widened to see more stocks.
Why filter by average volume above 1 lakh shares?
It keeps out illiquid stocks, including those in tight price circuits, so you can exit a trade when you want. A lower bar such as 50,000 also works.
What are ROE and ROCE?
ROE is return on equity, profit divided by shareholders’ equity. ROCE is return on capital employed, profit before interest and tax divided by capital employed. Above 15% is usually considered healthy.
Can I copy the results to TradingView?
Yes. The Stock Screener has a Copy to TradingView button that copies the whole list so you can paste it into a TradingView watchlist.
Does passing the screen mean I should buy?
No. A screen is a way to choose where to look. It is not a buy or sell signal, and past behaviour does not guarantee future results.